
From Wall of Text to Eye-Popping Dashboard in 5 Minutes Flat
You don’t have time to wrestle with formatting or design tools every time you need a slick report.
Whether it’s for a client, a classroom, or your team’s next big pitch, sitting there squinting at a block of text is not it.
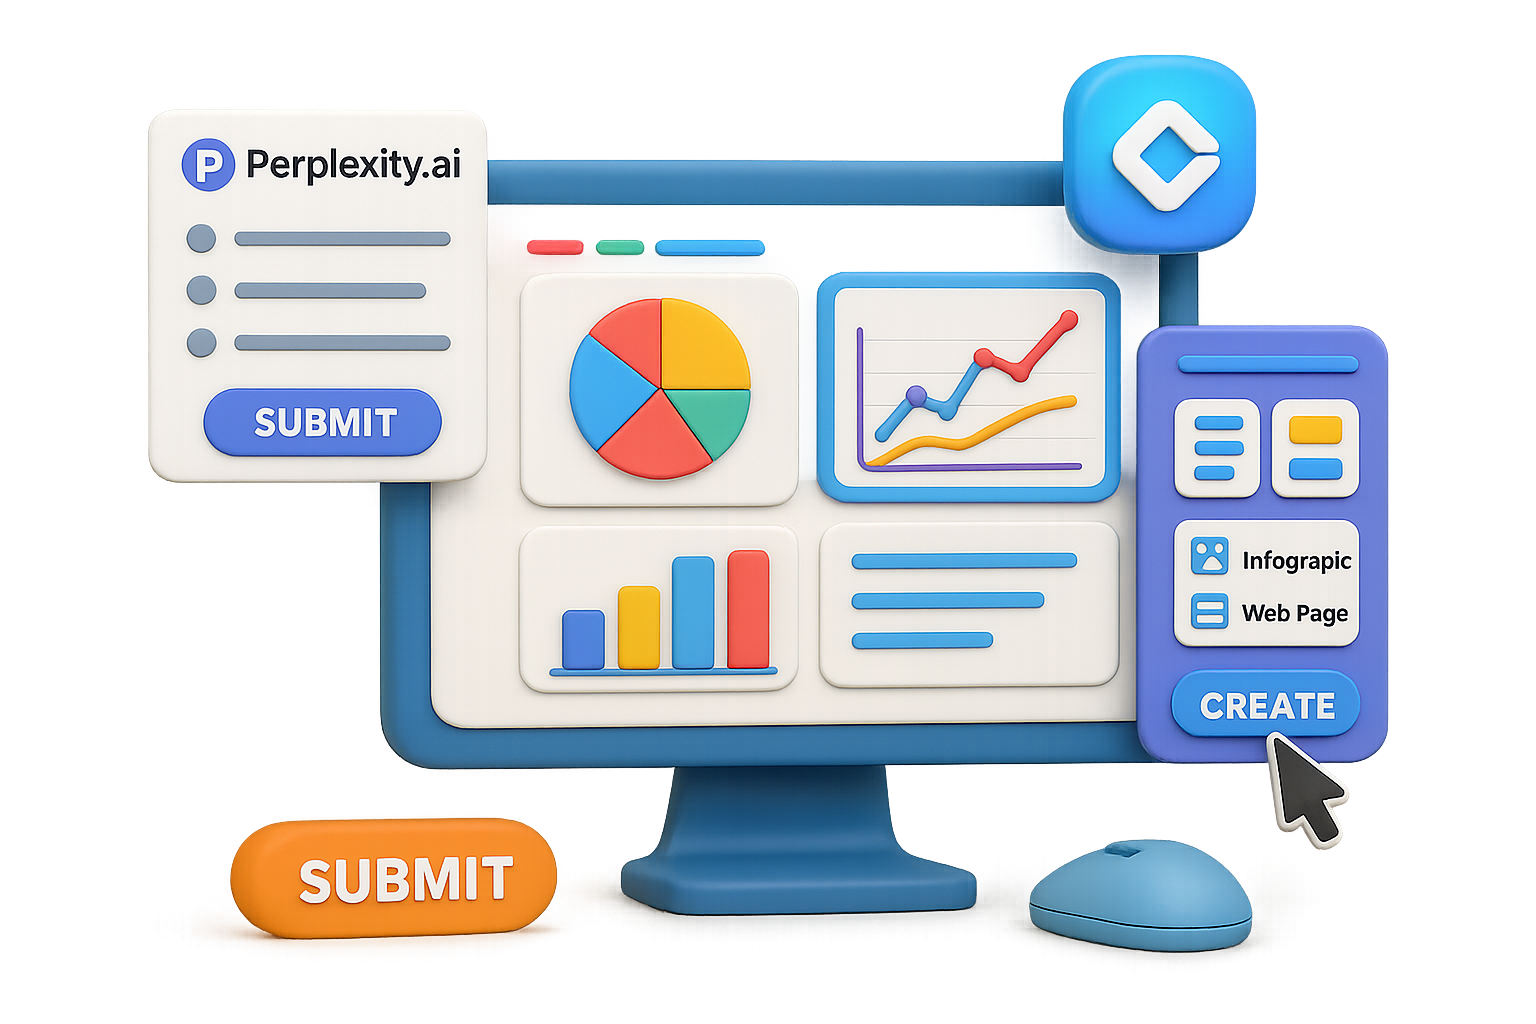
Here’s your shortcut: combine the brains of Perplexity.ai with the visual superpowers of Google Gemini Canvas—and turn raw data into interactive dashboards faster than your French press can finish.
Let’s get into it.

The Why: Insights in, Magic Out
AI isn’t replacing your workflow—it’s becoming the best coworker you’ve ever had.
Here’s what each tool brings to the table:
- Perplexity.ai gives fast, cited answers that actually make sense (goodbye, ChatGPT guesswork).
- Gemini Canvas transforms any wall of text into a polished web page, infographic, quiz, or even an audio explainer.
- Both tools are free to start—so budget isn’t your blocker.
Got 5 minutes? You’ve got a dashboard.

What You’ll Need
Minimal gear. No coding. Just:
- A free account on Perplexity.ai
- A Google account to access Gemini at gemini.google.com
- 3–5 minutes of curiosity and a mouse that works

Step-by-Step: Dashboard in Minutes
1. Pull Sharp Data from Perplexity
Start with a prompt that demands clarity and numbers. Try this one:
Analyze Tesla’s role in the global EV market through 2025.
Include revenue trends, vehicle deliveries, market share, main competitors, and key growth regions.
Focus on numbers, percentages, and concise insights suitable for a report.
You’ll get a response with stats, bullet points, and citations. Copy the whole thing—even the sources.
2. Activate Canvas Mode in Gemini
- Open Gemini, scroll to Tools, and flip the switch on Canvas.
- Skip the tutorial about describing bananas. You’re about to do something far cooler.
3. Paste It In, Let Gemini Flex
Drop your entire Perplexity response into Gemini’s chat. Hit Submit.
On the right, a “canvas” appears mirroring your content. That’s your workspace—now editable, transformable, and ready for magic.
4. Generate the Visualization You Need
Click Create below the canvas and choose your weapon:
- Web page – Ready-to-go HTML for blog posts or reports
- Infographic – One-pager gold for presentations or LinkedIn
- Quiz / flashcards / audio – Learning-and-development goldmine
In about a minute, Gemini rolls out a formatted, color-coded, media-rich layout. No drag-and-drop nightmares. Just done.
5. Refine with Prompts
Want to zoom in on the competition? Say:
Rebuild the web page, emphasising Tesla vs. major EV rivals.
Add a three-bullet takeaway summary at the top.
Gemini reshuffles the content like it’s no big deal (because it’s not, for an LLM).
Iterate until it sings.
6. Share or Ship It
- Hit Share for a live link you can drop in Slack, email, or Twitter.
- Use Code View to copy raw HTML/CSS for dev handoff.
- Snag charts/images directly from the Canvas view for slide decks.
Bonus Moves: Prompt Recipes
Need to tweak your dashboard even more? Try these prompt add-ons:
- “Highlight YoY growth in bold.” – Makes metrics pop for skimmers.
- “Add a heat map of Asia-Pacific EV adoption.” – Go regional fast.
- “Insert a 150-word executive summary at the top.” – Cue the applause from decision-makers.
- “Create a quiz to test this knowledge.” – Turn learning into action.

Best Use Cases? Basically Anything
If you’re working with data-heavy content, this workflow is pure gold. Perfect for:
- Quarterly market updates
- Stakeholder reports
- Lit reviews for academic projects
- Research for YouTube scripts
- Company knowledge bases or onboarding docs

Wrap-Up: From Info to Impact—Fast
Let’s face it—printers, slide decks, and PDF walls aren’t cutting it anymore. Interactive content wins attention, and speed wins projects.
Using Perplexity to grab smart, sourced insights and Gemini to instantly dress them up?
You just found your new power combo.
Want more beginner-friendly ways to get ahead with AI—without drowning in jargon? Tixu.ai is built for you. Bite-sized lessons, real-world use cases, and zero fluff.
Ready when you are.

Leave a Reply